Gold Price Analysis: Strategic Buying Opportunity After Recent Dip
📉 Current Price Correction Overview
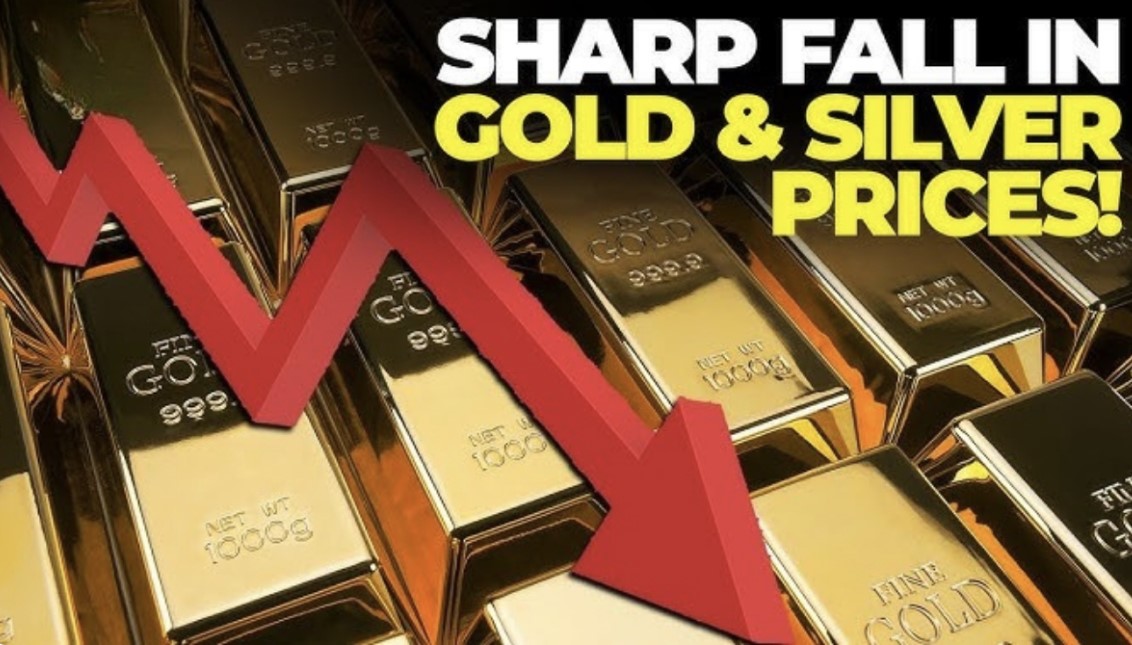
Gold has retreated from its June 13 peak of $3,400/oz to $3,374/oz (as of June 12), marking a 0.6% daily drop but remaining 17.5% higher year-to-date . Key drivers include:
- Technical pullback after RSI hit overbought levels (55+), signaling short-term profit-taking .
- Temporary dollar strength as Fed rate cut timing uncertainty triggers volatility .
- De-escalation hopes in Middle East conflicts, though risks persist .
🚀 5 Catalysts for Imminent Rebound
- Central Bank Demand Surge
- 900 tonnes expected in 2025 purchases (J.P. Morgan) , with Poland, China, and India leading acquisitions. Gold now comprises 20% of global reserves, eclipsing the euro .
- Fed Rate Cuts Looming
- September 2025 cut increasingly likely with softening CPI; historically, each 1% rate drop boosts gold 12-15% .
- Geopolitical Tinderbox
- U.S.-Iran tensions and Trump’s trade tariffs could ignite “fear-driven buying” similar to April’s spike to $3,498/oz .
- Dollar Weakness
- Dollar Index at 98.25 (2-month low) makes gold cheaper globally .
- Inflation & Debt Hedge
- U.S. debt at $36 trillion; gold’s role as a “debasement hedge” strengthens as real yields fall .
⚠️ Critical Risks to Monitor
| Risk Factor | Impact on Gold | Trigger Point |
|---|---|---|
| U.S. economic recovery | 10-15% correction | Strong jobs data delaying Fed cuts |
| Peace deals in Ukraine | Short-term sell-off | Trump-Putin negotiations |
| Dollar rally | Pressure on non-USD buyers | Fed hawkish pivot |
| “Fake gold” scams | Market distrust | Rising counterfeit bars in Asia |
💡 Strategic Buying Guide
Entry Points & Instruments
- Ladder Buying: Allocate funds at $3,350, $3,300, and $3,250 to average volatility .
- Physical Gold: Banks like ICBC (786.56元/g) offer better premiums than jewelers (周大福: 998元/g) .
- ETFs: U.S. funds saw 310 tonnes inflow in 2025; low-cost options like GLD ideal for liquidity .
Avoid:
- “Guaranteed return” schemes (e.g., Zhejiang Yongkun scams) .
- High-leverage futures during Fed blackout periods.
📈 Price Forecasts: Bullish Consensus
| Timeframe | Institution | Projection | Key Driver |
|---|---|---|---|
| Q3 2025 | Goldman Sachs | $3,700/oz | ETF demand + tariffs |
| Q4 2025 | J.P. Morgan | $3,675/oz | Recession hedging |
| 2026 | Citi | $4,000/oz | Debt crisis escalation |
| Bear Case | State Street | $2,600/oz (floor) | Rate cut delays |
🌍 Regional Market Shifts
- China: Youth shift to “New 3 Golds” (funds/bonds/gold ETFs) amid wedding gold rental trend .
- India: Tax cuts boost gold fund investments; imports up 19% MoM .
- Europe: ECB rate cuts could amplify gold’s €3,032/oz rally .
✅ Actionable Steps Before June 30
- Verify Sources: Use LBMA-approved refiners to avoid counterfeits .
- Diversify: Follow the “80/20 Rule” – 80% physical/ETFs + 20% miners/derivatives .
- Monitor Triggers:
- U.S. PPI data (June 14) and Fed meetings.
- Middle East conflict escalation risks.
“Gold’s dip is a breath, not a reversal. It remains the ultimate hedge against stagflation and policy chaos.”
– J.P. Morgan Commodities Team
Bottom Line: This correction is a strategic entry window, not a trend reversal. With 2025’s perfect storm of rate cuts, tariffs, and reserve diversification, gold’s path to $4,000/oz appears firmly intact. Deploy capital gradually, prioritizing liquidity and verification.
(Gold Price Trend Chart: 2024-2026 Projections with Key Catalysts)
Sources: World Gold Council, J.P. Morgan, Goldman Sachs, State Street Global Advisors.


